Your Intelligence Isn't a List. It's a Graph.
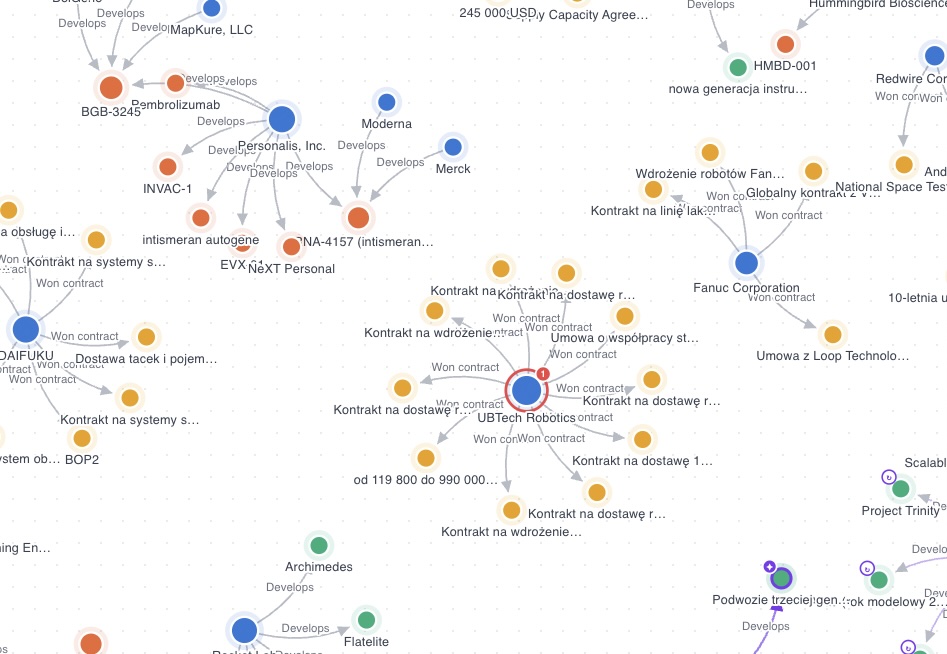
The value in market intelligence almost never sits inside a single article. It sits between articles: the same investor showing up in two different funding rounds, a supplier appearing in a competitor's press release and then in a bankruptcy filing, a founder leaving one company and quietly registering another. A feed can't show you that. A list can't show you that.
A graph can.
That's why we built the relation graph in Didascal. It's a short walkthrough here if you'd rather watch than read: see the relation graph in action.
What the relation graph actually is
Didascal already reads the sources you point it at, extracts the entities you care about, and deduplicates them - so "Acme Sp. z o.o.", "ACME", and "Acme Group" collapse into one record rather than three.
The relation graph is the layer on top of that. Every entity becomes a node. Every co-occurrence, transaction, ownership link, personnel move, or partnership mentioned in your sources becomes an edge. What you get is a living map of the segment you're tracking, assembled from material you were already collecting.
Nothing is hand-drawn. You don't maintain it. It grows as your agents keep reading.
What it does
Turns co-occurrence into structure. Two entities mentioned in the same context aren't automatically related - but the pattern of repeated co-occurrence across independent sources usually is. The graph surfaces that pattern instead of asking you to hold it in your head.
Keeps the evidence attached. Every edge points back to the article, filing, or page that produced it. This matters more than it sounds. Click a connection, read the source, decide for yourself whether it holds.
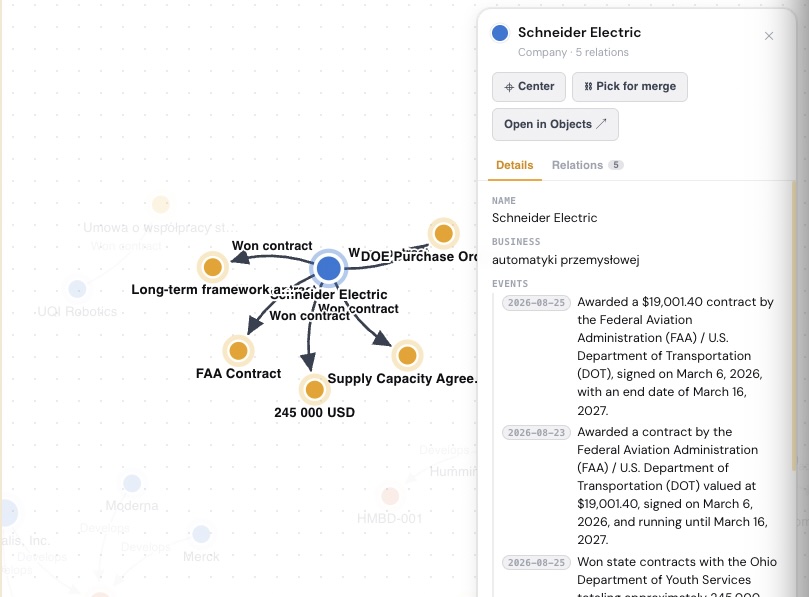
Lets you filter to the question you're asking. The full graph of a mid-sized sector is noise. Filtering by entity type, relationship type, or time window turns it into an answer. Show me only ownership links. Show me only what changed this quarter. Show me everything within two hops of this one company.
Reveals the shape of a market, not just its members. A list of forty companies tells you who exists. A graph tells you which three of them sit at the centre of everyone else's supply chain - and which one is isolated, which is often the interesting one.
Why it's worth your time
You find the non-obvious target. For M&A work, the graph is the difference between a screening list and a thesis. Succession risk, financial stress signals, and ownership concentration are all easier to spot when you can see how an entity is embedded in its network rather than reading its profile in isolation.
You onboard a new market faster. Dropping into an unfamiliar segment normally means weeks of reading before the names stop blurring together. Point Didascal at the segment, let it run, and open the graph. You get the map first and the detail second, which is the correct order.
You notice change instead of chasing it. New edges appearing around an entity you're tracking is a signal in itself. A company that suddenly acquires four new connections in a month is doing something. The graph makes that visible without anyone writing a report about it.
You brief other people in thirty seconds. A graph screenshot in a partner meeting does work that a six-page memo doesn't. People argue with prose. They point at graphs.
You stop losing institutional memory. When the analyst who "knows the space" leaves, the knowledge usually leaves with them. A graph built from sources is a durable asset that survives staff turnover.
Where it fits in the workflow
The relation graph isn't a separate product bolted onto the side. It sits in the middle of the loop Didascal already runs:
- You define a goal and the entity types that matter - companies, people, products, technologies, whatever your domain uses.
- Agents monitor sources and extract entities, deduplicating as they go.
- Relations are inferred from the material and rendered as a graph.
- You inspect it, spot something worth watching, and Didascal can spin up a tracking agent for that entity. New findings flow back into the graph, and it gets denser.
The human stays in the loop where humans are useful - deciding what deserves attention - and stays out of the loop where they aren't, which is copying names into a spreadsheet.
Try it
If you're tracking a market, a competitive set, or an acquisition pipeline, the relation graph is probably the fastest way to see what your own data already knows and hasn't told you yet.
Watch the walkthrough: Relation graph in Didascal
Then point it at your own segment and see what connects.